
Last year I decided to start swimming regularly. At the time I thought it would be a good time to look at what public data is available about public pool water quality in Estonia. I found that, with some exceptions, the vast majority of swimming pools in Estonia had passed the health board inspection. Whats more they had been doing this consistently since the 1990s. Good news, the pools were safe to swim in.
But, I still felt kinda funky after each time I went swimming. Maybe I’m just paranoid…
This got me thinking. Even if the pools are safe, they can still be dirty. So I decided to dig up the pool data again and take a closer look at the specific tests that the health board does.
!!! Keep in mind that I am in not in any way qualified to assess what water quality test are good or bad, or to criticize the methodology of the health board officials. This is just a curios look into the data sets that are publicly available.
Get the data
Estonia and The City of Tallinn has pretty good public data infrastructure. For example there is the national open data platform that collects public domain data sets from government institutions
It’s a great resource and contains droves of interesting data waiting for analysis or visualization.
I was more interested in water quality data and sure enough the data was listed in the portal:
https://opendata.riik.ee/en/andmehulgad/basseinid/
https://opendata.riik.ee/en/andmehulgad/basseinide-veeproovid/
https://opendata.riik.ee/en/andmehulgad/ujulad/
No scraping necessary, that’s a great start 😀
It’s in XML…parse the data
Not so fast though. The data is offered in XML format. This presented some problems. I couldn’t read the XML data straight into an analysis tool. I had to extract and transform it to a more normalized shape first.
Admittedly I have never really felt comfortable parsing XML. I manage, but I have the sinking feeling I am doing something completely backwards. No point in moaning about it though. I fired up Python and got started.
I used ElementTree library to digest the XML in python. First I created a dictionary of lists of what I wanted my output data to look like. This was also temporary storage for the data I got out of the XML. I know there are some better ways to parse the file, but I wanted to get the data out quick so I just started looping over the different levels of the XML tree structure. Appending each records most granular level of detail into my directory. Afterwards I transformed the directory into a pandas dataframe and saved the output in a csv.
import urllib
import pandas as pd
import xml.etree.cElementTree as et

url = 'http://vtiav.sm.ee/index.php/opendata/basseini_veeproovid.xml'

parsed_data = et.parse(urllib.request.urlopen(url))

proc_data_dict = {
    'pool_id': [],
    'pool_nm': [],
    'test_dt': [],
    'proc_id': [],
    'proc_rs': [],
    'proc_test_nm': [],
    'proc_test_rs': [],
    'proc_test_val': [],
    'proc_test_unit': []
}

tree = parsed_data
root = tree.getroot()

for i in root:
    for i2 in i:
        for i3 in i2:
            if i3.find('hinnang') != None:
                for i4 in i3:
                    for i5 in i4:
                        if i5.find('id') != None:
                           proc_data_dict['proc_id'].append(i3.find('katseprotokolli_number').text)
                           proc_data_dict['proc_rs'].append(i3.find('hinnang').text)
                           proc_data_dict['proc_test_nm'].append(i5.find('nimetus').text)
                           proc_data_dict['proc_test_rs'].append(i5.find('hinnang').text)
                           proc_data_dict['proc_test_val'].append(i5.find('sisaldus').text)
                           proc_data_dict['proc_test_unit'].append(i5.find('yhik').text)
                           proc_data_dict['pool_id'].append(i.find('bassein_id').text)
                           proc_data_dict['pool_nm'].append(i.find('bassein').text)
                           proc_data_dict['test_dt'].append(i.find('proovivotu_aeg').text)

pd.DataFrame(proc_data_dict).head()
Not too bad. I got the data out, but that nested for loop hurts my brain. Here is the output:
| pool_id | pool_nm | test_dt | proc_id | proc_rs | proc_test_nm | proc_test_rs | proc_test_val | proc_test_unit |
|---|---|---|---|---|---|---|---|---|
| 0 | 344 | Laine SPA bassein | 01.10.2020 09:00 | KL2015/V48283K | ei vasta nõuetele | Seotud kloor (<31 °C) | ei vasta nõuetele | 1.4 |
| 1 | 344 | Laine SPA bassein | 01.10.2020 09:00 | KL2015/V48283K | ei vasta nõuetele | Hägusus | vastab nõuetele | 1.0 |
| column name | description |
|---|---|
| pool_id: | unique id for each pool in a recreation center |
| pool_nm: | pool name (in Estonian) |
| test_dt: | date of procedure |
| proc_id: | unique id for procedure |
| proc_rs: | procedure result (vastab nõuetele – test passed ; ei vasta nõuetele – test not passed) |
| proc_test_nm: | name of test in a procedure |
| proc_test_rs: | result of test in a procedure |
| proc_test_val: | value of test in a procedure |
| proc_test_unit: | mesuring unit of test value |
Analyze and visualize
At first I wanted do to the whole process in Python.
But I was getting a bit tired and when I’m tired or lazy I prefer to explore data in Tableau.
I feel like it gives me a more responsive experience to follow my thoughts and to quickly chase any rabbit holes I find.
I’m not going to look at the ok/not ok’s the health board gives out that indicates when the pool is unsafe to swim in and needs to be closed. Instead I want to look at the detail. There are dozens of test procedures that go into measuring if a pool is clean or not. These include but are not limited to :
- Levels of ammonia
- Levels of Coli type bacteria
- Levels of all kinds of other bacterial
- Levels of chlorination
- Transparency of water
Considering this I generated new fields in the data
- total number of test procedures
- no of failed test procedures
- ratio of failed to total test procedures (failure rate)
- median monthly failure rate for each pool
Using these new fields I focused on the top (or rather worst) performers. The top 11 pools that have a median test procedure failure rate of over 50%.
This dubious honor goes to the following establishments:
| Pool name | Median test procedure failure rate |
|---|---|
| Kreutzwald Hotel Tallinn Zen-SPA | 50% |
| Kristiine spordihalli ujula | 50% |
| MTÜ Spordiklubi Garant ujula | 50% |
| Sanatoorium Tervis Vabaajakeskus | 50% |
| Tervise Paradiisi veekeskus | 50% |
| Viiking Saaga vee- ja saunakeskus (E-korpus) | 56% |
| Estonia Termid | 57% |
| PANNJÄRVE TERVISESPORDIKESKUS SA ujula | 58% |
| Pärnu Spordikooli ujula | 62% |
| Tootsi | 62% |
| TRK Viiking saunakeskus (C-korpus) | 73% |
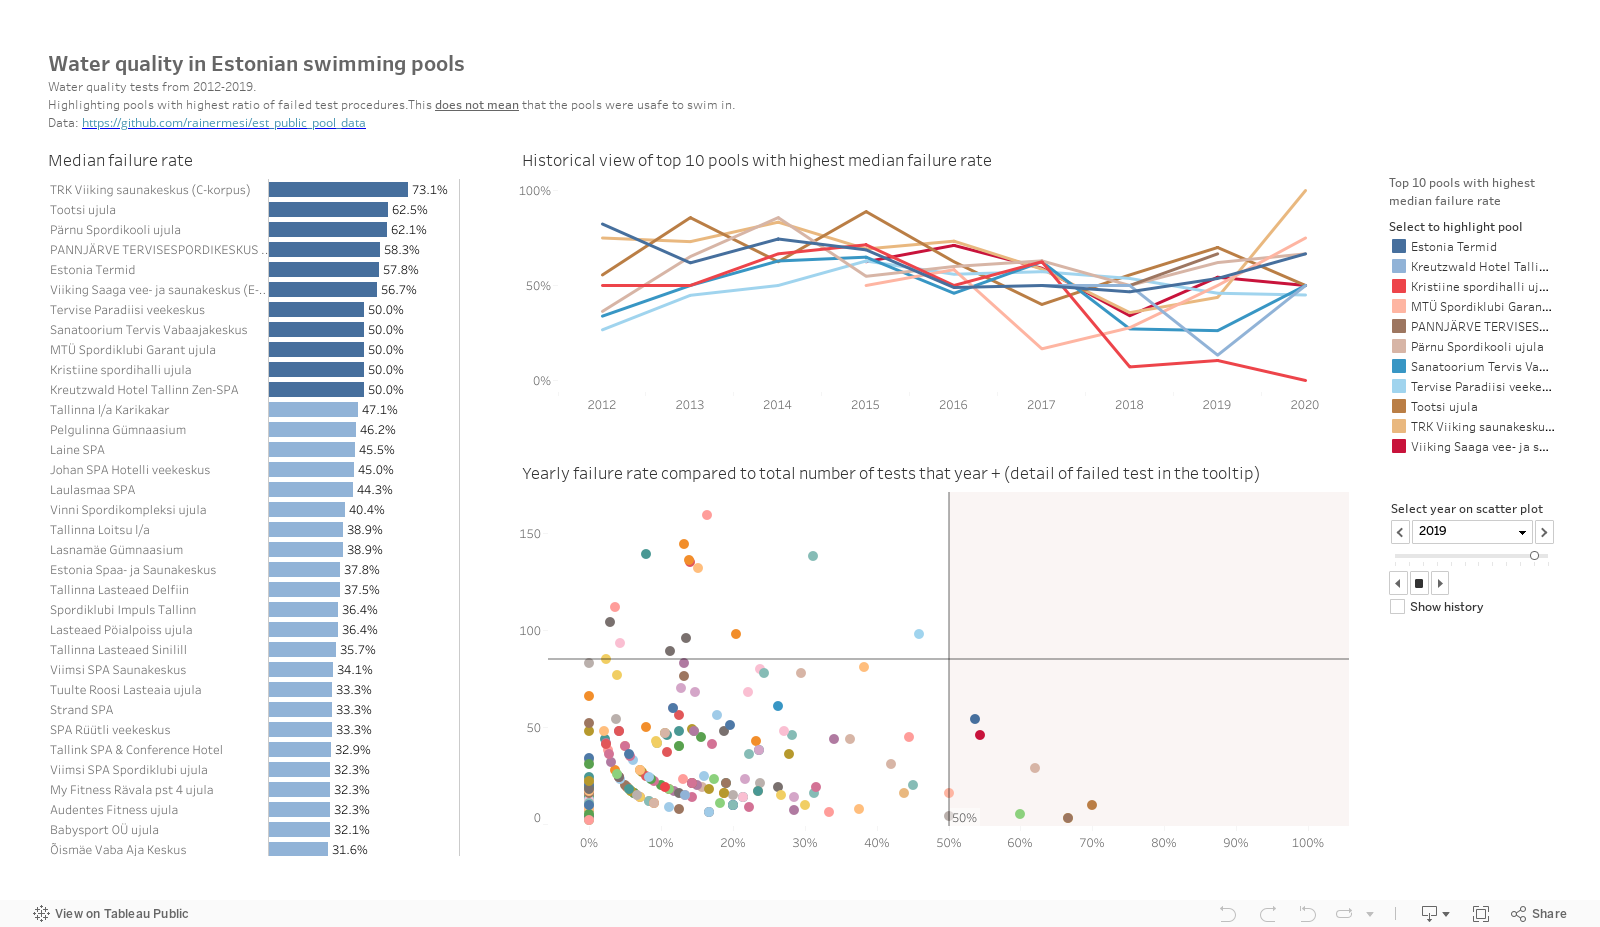
I also created an interactive dashboard and loaded in onto Tableau Public. Click below to take a look.
- You can see the median failure rate on the left.
- The historical failure rate of the top 11 is displayed in the top right.
- The scatter plot on the bottom right plots the historical failure rate for all pools that were still active in 2019.
When you hover on the marks on the scatter plot you can also see a detailed breakdown of total vs failed tests and the specific tests each pool failed at each year.
There we go. Yes, some pools might still be dirty, I am not paranoid 🙂
I would love to get back to this data in the future. I would like to learn more about the tests the health board run, what are each tests implications on health and what are the official limits for each test.
The data set is also quite rich and I only extracted a slice of it. If you are curious you could look at the performance of specific tests or search for correlations between seasonality and test results. Maybe the capacity of the pools and the locations of the pools also affect the water quality measurements?
I also uploaded the code and the csv’s to my github
All the best
Rainer
